When investors borrow against a rental, they tend to borrow big
Griffin Funding reports that investors are borrowing significantly more through HELOCs on rental properties, averaging

Press Release Disclaimer: This is a press release distributed through the XPR Media network. It has not been independently verified by our newsroom.



PeopleImages // Shutterstock
When investors borrow against a rental, they tend to borrow big
Most people who take out a home equity line of credit (HELOC) are borrowing against the house they live in, and most of them borrow a fairly modest amount. The typical draw looks like a kitchen renovation or a consolidated credit card balance.
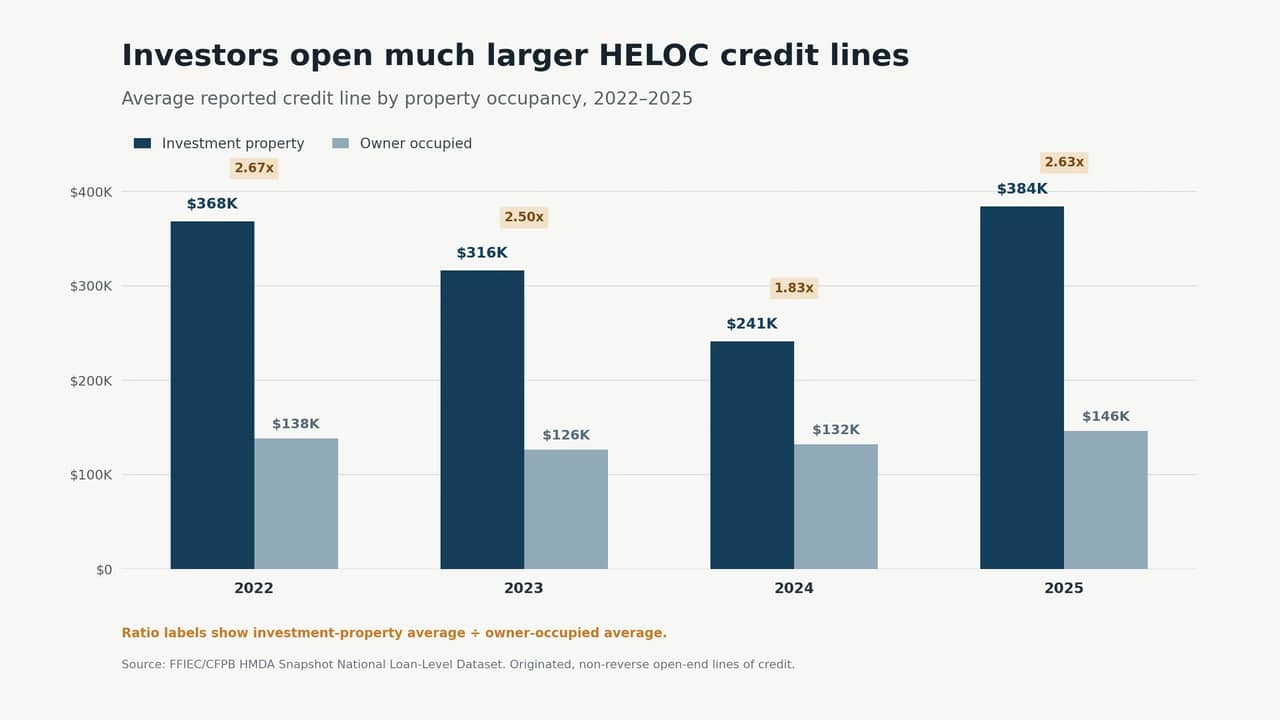
Real estate investors are doing something different. When they open a line against a property they own but do not live in, the average reported credit line is roughly two and a half times the size of an owner-occupied HELOC. That gap appears in every year of the Home Mortgage Disclosure Act (HMDA) data analyzed, and in 2025 both the reported number of those loans and their average line size reached four-year highs.
The figures come from a Griffin Funding analysis of HMDA loan-level data, published by the Federal Financial Institutions Examination Council (FFIEC) and the Consumer Financial Protection Bureau (CFPB), covering every reported HELOC origination from 2022 through 2025. That data records whether a property is a principal residence, a second home, or an investment property, but no published report breaks HELOC originations out that way, so the numbers below have not appeared anywhere before.
What the data shows
In 2025, lenders originated 27,183 HELOCs on investment properties, worth $10.4 billion. The average line was $384,000. Over the same year, owner-occupied HELOCs averaged $146,000. All figures in this section come from the HMDA loan-level datasets linked above.
Griffin Funding
The consistency matters more than any single year. Owner-occupied HELOC line sizes moved 15% between their low and high from 2022 through 2025. Investment-property line sizes swung 59% over the same stretch and never fell below 1.8 times the owner-occupied average.
The gap isn’t a fluke of one hot year, either. Even as the market cooled off after 2022, investors kept borrowing bigger.
These loans remain a small slice of the overall market, 2.27% of HELOC originations in 2025. But that share is the highest since 2022, and the origination count is up 47% from its 2023 trough.
Why the money is moving this way
The reason is a mortgage nobody wants to give up. Millions of homeowners hold first mortgages near 3%. Refinancing to pull cash out means surrendering that rate for something more than twice as high, so fewer people are doing it. They are borrowing against equity instead and leaving the original loan untouched.
The Federal Reserve Bank of New York’s Household Debt and Credit Report put HELOC balances at $459 billion in the second quarter of 2026, a 17th consecutive quarterly increase and $142 billion above the low reached in early 2022. Intercontinental Exchange’s Mortgage Monitor reported that mortgage-holder equity reached a record $18 trillion over the same period, with $11.7 trillion of it tappable across 47.5 million borrowers while keeping a standard equity cushion.
An analyst at S&P Global Ratings told National Mortgage News that second liens and HELOCs should keep growing precisely because so many borrowers are sitting on cheap first mortgages and expensive equity at the same time. Researchers at Bank of America, quoted in the same publication, expect $41 billion in second-lien and HELOC bond issuance this year, against $30 billion last year.
For an investor, that math is not a compromise, but is the whole point. Consider someone who bought a $320,000 rental in 2021 at a 6% rate. By 2026, the property has enough equity to fund a down payment on the next one, and refinancing would mean giving up the 6% loan. Opening a line against the property instead, at somewhere around 8% to 9%, lets them draw $65,000 while the original mortgage stays exactly where it is. Only the drawn balance carries the higher rate, and only until the next property starts covering it.
One explanation for the larger lines is how investors can use their equity. A homeowner might tap equity for a renovation or another household expense, while an investor may use it to help fund another acquisition. In that case, the amount of credit sought can be tied to the capital required for the next property rather than the cost of a home-improvement project.
Where it concentrates
Hawaii leads the country by a wide margin, with 11.5% of its 2025 HELOC originations going to investment properties, roughly five times the national rate. Oklahoma follows at 5.8%, then Mississippi at 5.5%, Louisiana at 5.2%, and Nevada at 4.7%. Colorado and California both sit above 4% on much larger origination bases.
At the other end, Ohio came in at 0.8%, with Wisconsin, Michigan, New Hampshire, and Indiana all near or below 1.1%. These state figures are drawn from the same HMDA 2025 dataset.
The financing behind it
Investment-property borrowers frequently cannot document income the way agency underwriting requires, which is why much of this lending happens outside conventional channels. Loans underwritten on a property’s rental income, known as debt service coverage ratio (DSCR) loans, and loans underwritten on deposit history rather than tax returns have become the dominant alternative-documentation categories in the non-qualified mortgage (non-QM) market. EFMT 2026-NQM1, a $566.7 million transaction rated by Kroll Bond Rating Agency in February 2026, drew 87.4% of its 1,275-loan pool from those two categories plus asset-based documentation.
That market has scaled quickly. KBRA put non-QM issuance at $33 billion through August of 2025 in its Non-QM RMBS (residential mortgage-backed securities) Default Study, tracking to match or beat the prior year’s record. Its 2026 presale reports also cover two Goldman Sachs securitizations backed entirely by DSCR collateral, GSMBS 2026-DSC1 at $301.8 million across 1,331 rental-property mortgages and GSMBS 2026-DSC2 at $304.1 million across 1,373.
Growth of that speed invites scrutiny. Moody’s Ratings noted in its 2026 RMBS outlook that some lenders have loosened DSCR underwriting, including accepting full lease amounts without capping them against market rents. Standards that slip during an expansion tend to surface in performance data a few years later.
Methodology
Figures are drawn from the FFIEC and CFPB HMDA loan-level datasets for 2022 through 2025, filtered to originated, nonreverse open-end lines of credit and grouped by occupancy type. Totals were validated against the CFPB’s published annual HELOC origination counts in its Data Point: Mortgage Market Activity and Trends reports and matched within 0.05% for every benchmarked year. Puerto Rico was excluded from state rankings for insufficient sample size.
HMDA records occupancy but not underwriting method, so this analysis covers investment-property HELOCs of all types and cannot isolate any single loan product. Because the HMDA open-end reporting threshold changed after 2021, multiyear volume growth is calculated from 2022 onward.
This story was produced by Griffin Funding and reviewed and distributed by Stacker.